In order to evaluate the performance gains of the partitioning strategy
described in the previous section, we consider the parallelisation of the
code shown in figure 4, which corresponds to the multiplication
of two upper triangular 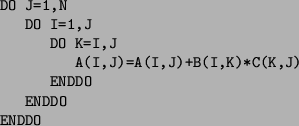 matrices [6] (the two outer
loops have been interchanged in order to increase the number of
unit stride array references).
Clearly, the loop nest
is canonical (see Definition 3.1), and, given that it has a depth
of 3, a partitioning scheme based on the proof described in
Theorem 3.1 may lead to perfect load balance.
We compared this scheme (henceforth denoted by CAN)
with three other compile-time mapping
schemes, subsequently denoted by the shorthands KAP, MARS,
and CYC; KAP corresponds to the mapping
strategy of the KAP auto-parallelising compiler (which is based
on scheduling chunks of consecutive iterations having a fixed size),
MARS corresponds to the mapping
strategy of the MARS experimental parallelising compiler [2]
(which is equivalent to compile-time partitioning into a number of
chunks of consecutive iterations equal to the number of processors),
and CYC corresponds to a cyclic (or wrap [5])
way of mapping the iterations onto processors (i.e., processor 0 executes
iterations
matrices [6] (the two outer
loops have been interchanged in order to increase the number of
unit stride array references).
Clearly, the loop nest
is canonical (see Definition 3.1), and, given that it has a depth
of 3, a partitioning scheme based on the proof described in
Theorem 3.1 may lead to perfect load balance.
We compared this scheme (henceforth denoted by CAN)
with three other compile-time mapping
schemes, subsequently denoted by the shorthands KAP, MARS,
and CYC; KAP corresponds to the mapping
strategy of the KAP auto-parallelising compiler (which is based
on scheduling chunks of consecutive iterations having a fixed size),
MARS corresponds to the mapping
strategy of the MARS experimental parallelising compiler [2]
(which is equivalent to compile-time partitioning into a number of
chunks of consecutive iterations equal to the number of processors),
and CYC corresponds to a cyclic (or wrap [5])
way of mapping the iterations onto processors (i.e., processor 0 executes
iterations
![]() , processor 1 executes iterations
, processor 1 executes iterations
![]() , in general, processor
, in general, processor ![]() ,
,
![]() ,
executes iterations
,
executes iterations
![]() ).
).
The parallelised programs were run on a KSR1, using two different
values for N, ![]() and
and ![]() ; their execution time is shown
in Table 1. In both cases, KAP and MARS perform
worst of all while CAN performs best. The performance of CYC
is comparable with that of CAN when using a relatively small number
of processors; for more than 12 processors, CYC causes a large
number of cache misses.
; their execution time is shown
in Table 1. In both cases, KAP and MARS perform
worst of all while CAN performs best. The performance of CYC
is comparable with that of CAN when using a relatively small number
of processors; for more than 12 processors, CYC causes a large
number of cache misses.
| Mapping | Number of processors | ||||||
| N | scheme | 1 | 2 | 4 | 8 | 12 | 16 |
| 256 | KAP | 4.03 | 3.64 | 2.78 | 1.71 | 1.12 | 0.97 |
| MARS | 3.99 | 3.63 | 2.76 | 1.68 | 1.06 | 0.95 | |
| CYC | 4.02 | 2.05 | 1.07 | 0.55 | 0.40 | 0.35 | |
| CAN | 3.99 | 2.03 | 1.04 | 0.51 | 0.38 | 0.29 | |
| 1024 | KAP | 527 | 458 | 308 | 174 | 128 | 110 |
| MARS | 524 | 457 | 310 | 179 | 130 | 113 | |
| CYC | 525 | 267 | 154 | 69 | 55 | 49 | |
| CAN | 524 | 265 | 152 | 66 | 46 | 36 | |