
David Buckley
Experiments » Short-Term Skill Capture in a First-Person Shooter
Aim
Expanding on the previous experiment, this project had three main objectives:
- Create a more substantial data set
- Understand the skill metrics being used
- Find out how quickly we could predict skill.
This page therefore serves as a supplement to the following paper:
- D. Buckley, K. Chen, J. Knowles. Rapid skill capture in a first-person shooter. PDF
Data Collection
We asked several players to play numerous games of Red Eclipse, an open-source first-person shooter. An information sheet and tutorial were provided to each participant:
Each game loaded directly into the map, and lasted 3 minutes. A bash script controlled the experimental parameters, loading the following config file which controlled the game:
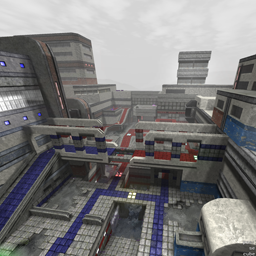
There were eight maps that were chosen for the experiment. They were selected by the experimenter randomly, but in such a way that each player played most of the content. The maps used, and the number of players for each map, were:
 Bath (6 players)
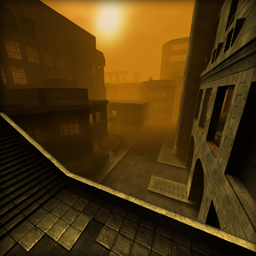 Delicatessen (8 players)
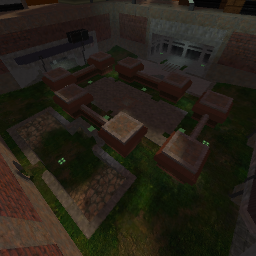 Echo (6 players)
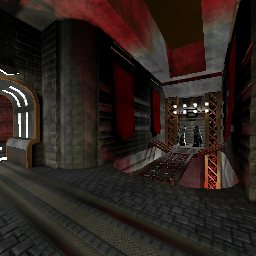 Error (6 players)
 Foundation (6 players)
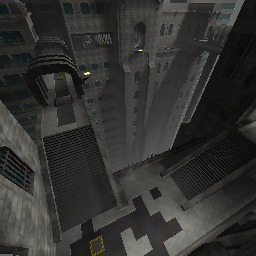 Ghost (6 players)
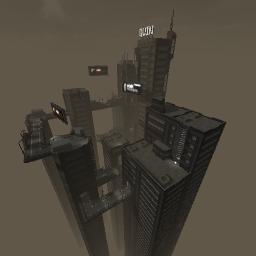 Ubik (8 players)
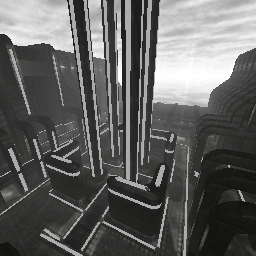 Wet (6 players)
In contrast, there were six different ranges of bot difficulty available. Red Eclipse uses a minimum and maximum bot difficulty to determine how hard the enemies are, and are defined by these ranges. From each range, Red Eclipse chooses a uniformly random number for each enemy. The TrueSkill values in this table indicate the values assigned to the ranges after the preliminary run of the TrueSkill algorithm.
| Bot min | Bot max | TrueSkill μ | TrueSkill σ |
|---|---|---|---|
| 40 | 50 | 18.944 | 0.639 |
| 50 | 60 | 20.775 | 0.638 |
| 60 | 70 | 20.593 | 0.638 |
| 70 | 80 | 23.685 | 0.637 |
| 80 | 90 | 26.342 | 0.638 |
| 90 | 100 | 31.441 | 0.638 |
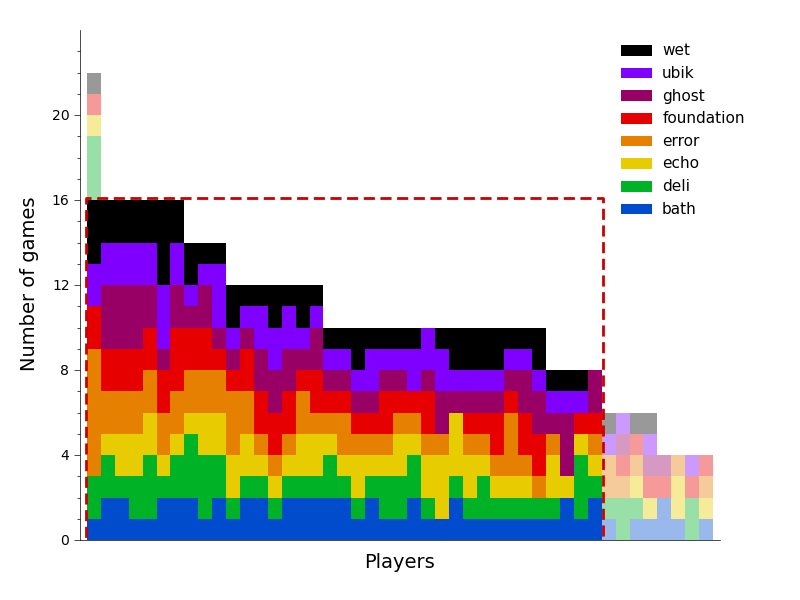
A total of 476 games were played by 45 participants. These players have been visualized below. The colour indicates which maps the player has played, and the dashed box the games that were used in the paper.
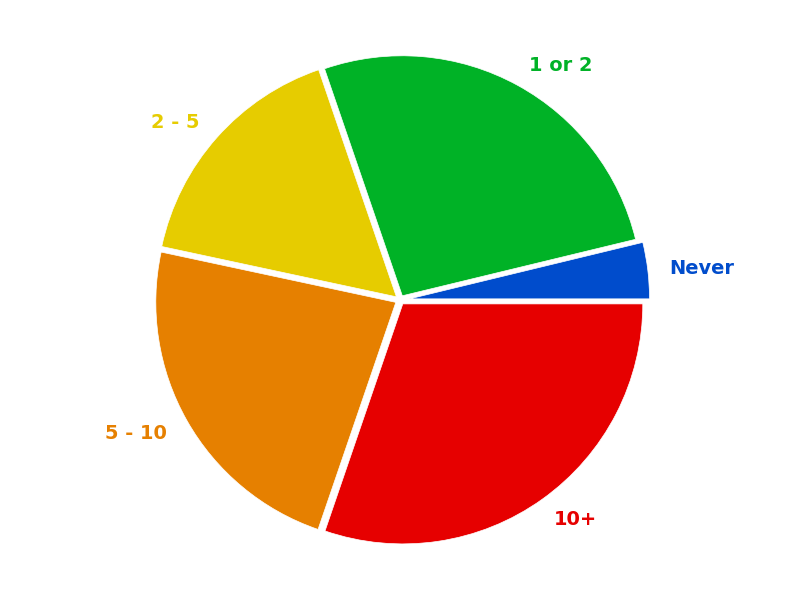
The distribution of the games according to the number of FPSs the player had previously played is presented here:
Questionnaires
There were two different questionnaires used for recording player experience. The first was Likert-based, the second 4 alternative forced choice. The Likert questionnaire was asked after every game played, and used the following questions:
| Question | Minimum | Range | Maximum |
|---|---|---|---|
| How much would you want to continue playing the game? | Not at all | 1 - 5 | Really want to |
| How frustrating did you find the game? | Not at all | 1 - 5 | Really frustrating |
| How challenging did you find the game? | Not at all | 1 - 5 | Very challenging |
| How lost did you feel while playing the map? Did you find it difficult to navigate around the terrain or buildings? Did you know where you were most of the time? |
Not at all | 1 - 5 | I had no idea where I was |
The 4-AFC questionnaire was asked after every pair of games. The answers were restricted to: Game A, Game B, Neither and Both Equally. The questions were similar to those of the Likert questionnaire, but were given as:
- Which did you want to keep playing most?
- Which game was most frustrating?
- Which game was most challenging?
- Which map was the most complex?
Features
We extracted features from both the mouse and keyboard. The features have been listed in detail here.
Data
The data from the experiment comes in three parts: the games played, the users that took part, and a list of sessions, which connect the two. Each of these is stored in JSON format. For convenience, the Python objects are also provided here, along with some scripts for using them.
There were three games which the first few seconds of data are missing. This occurred when the participant started the game before they had finished filling in the questionnaire. User 44 played less than 8 games, and as such did not appear in the paper. The three games are:
| Game ID | User ID | Game Number | Map | Time Missing (s) |
|---|---|---|---|---|
| 38 | 13 | 3rd | Bath | 18.612 |
| 93 | 44 | 4th | Bath | 16.811 |
| 139 | 30 | 8th | Deli | 21.166 |
While there are only 45 participants who took part in the experiment, there are 65 user objects. When people returned for the second run of the experiment, the questionnaire was asked again. These second answers have been stored for reference, but were not considered in the experiment.
JSON Files
The user data and session data are collated into single JSON objects containing a list of each item. The games, on the other hand, are stored separately, due to their size, and have been zipped together here.
Python Files
The python objects are stored in the same style as the JSON files. They were saved using the cPickle module.
The associated Python classes can be found contained within this Python package.
Using the Data
The above Python package contains some helper modules, including datamanager, which aids loading the games and holding them for manipulation. Other modules include the storage modules, such as gamestorage. These allow for the games to be saved and loaded from different file formats. Some examples of their use have been listed here.
load.py
// May need to add autoclass to PYTHONPATH.
import autoclass.datamanager

try:
  manager
except NameError:
// Assumes the games and user data are unzipped to data
  manager = autoclass.datamanager.DataManager('data')

// Get the set of games used in the experiment.
games = manager.getGames(8, 16, sort=True)
users = manager.getUsers(games)
Load game files
Uses the above example Python script.
> execfile('load.py')
Get the score and rank for each game
> from autoclass.scoreboard import Scoreboard
> scores = []
> ranks = []
> for game in games:
>   gameScoreboard = Scoreboard(game)
The player is client number '0'
>   scores.append(gameScoreboard[0])
>   ranks.append(gameScoreboard.ranking(0))
Get the deaths from the first 30s of a game
> from autoclass.game import DeathEvent
Event times are in milliseconds.
> deaths = games[0].getEventsOfType(DeathEvent, end=30000)
The time of the last death in this period (in seconds).
> deaths[-1].timestamp / float(1000)
If there are any issues with the code or data provided, please contact me.